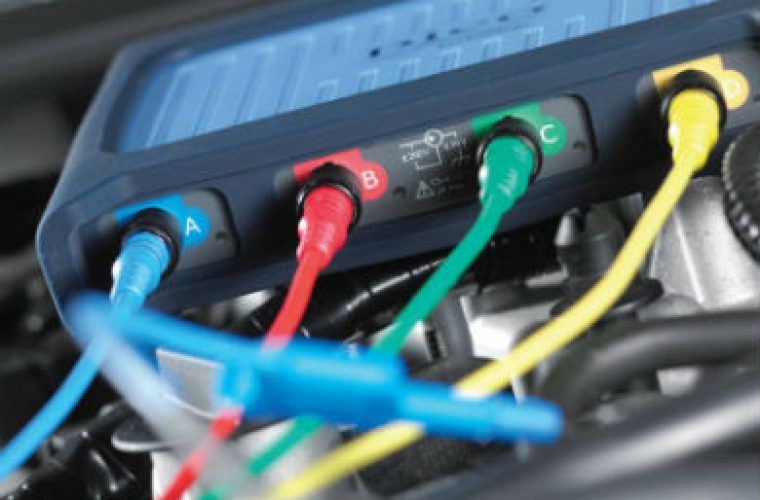
If you are new to PicoScope you may be wondering exactly how you can use it, and what benefits it will have for your workshop.
With this in mind, Pico Technology has shared a list of common uses for the PicoScope.![]()
6. Wiggle test
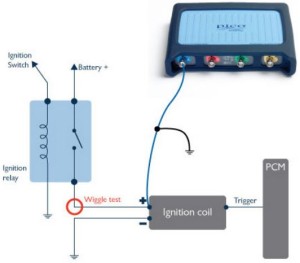 PicoScope captures data so fast it is easy to identify wiring or connection issues quickly.
Simply wiggling a wire can reveal a wiring fault.
This test is used when you have spotted an intermittent fault with a signal (so a connection is already made).
Start PicoScope when you are ready to capture the signal, and gently wiggle the wiring loom attached to the component.
Pico Technology recommends reducing the capture rate to make it easier to spot problems within a single screen capture.
Masks and alerts can be used to automate detection when signals go outside normal limits.
Stop PicoScope and scroll back through the data with the buffer controls.
Often wiring or connection faults will create an inconsistent pattern as illustrated in the example.![]()
7. Lambda sensor testing
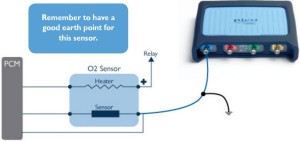 Locate the sensors with the help of your vehicle’s technical data.
Pico Technology recommends using either back-pinning probes or breakout leads to make the connection.
Use the technical data to identify the output signal wire from the lambda sensor harness connector.
The engine is required to be at normal operating temperature in order to produce a valid signal.
Start PicoScope when you are ready to capture the signal.
Depending on the type of lambda sensor, the signal will be seen to cycle high and low in a consistent manner with curved edges.
These sensors generally switch high and low once per second.![]()
![]()
8. Air Flow Meter/Mass Airflow Sensor
Locate the sensors with the help of your vehicle’s technical data.
Use either back-pinning probes or breakout leads to make the connection and use the technical data to identify the signal wire.
You can choose to check multiple terminals to obtain a signal.
Start PicoScope, and snap the throttle quickly from idle to full throttle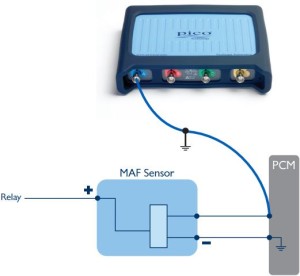 to capture the waveform.
Pico Technology suggests a timebase of 1 s/div to capture ten seconds of data in one frame.
The voltage output from the Air Flow Meter (AFM) should be proportional to airflow.
The waveform should show approximately 0.5 volt when the engine is at idle, but this voltage will rise as the engine is
accelerated, to around 4.0 to 4.5 volts.
This voltage will, however, depend on how hard the engine is accelerated, and a lower voltage is not necessarily a fault within the AFM.
On deceleration the voltage will initially fall as the throttle is closed, reducing the airflow as the engine returns to idle speed.![]()
9. CAN high and CAN low
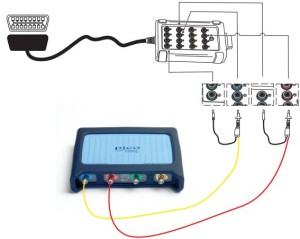 Use the Pico Technology CAN test breakout box to make a secure connection to the vehicle’s communication signals.
When it is connected to the vehicle’s EOBD socket, the LEDs on the breakout box will light up to indicate that communication is established.
Connect the yellow lead to channel A of the scope and to pin six, then the black pin to pin four (chassis GND).
Connect the red lead to channel B of the scope and to pin 14.
Some vehicles can have multiple CAN connections on the 16-pin connector, and some vehicles may use pin five (signal GND) instead of pin four.
Start PicoScope and turn on the vehicle ignition, you should now see a waveform.
The waveform should reveal to you that data is being exchanged continuously along the CAN bus.
The signals should be mirror images of each other and there should always be two signals present.
It is also possible, of course, to check that the peak voltages are correct.
The workshop manual should be referred to for precise waveform values.![]()
![]()
10. WPS500X compression testing
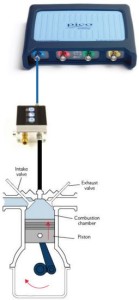 Connect the WPS500X pressure transducer to PicoScope with the BNC to BNC cables provided and attach the transducer, as you would any compression gauge, by removing a spark plug and properly disabling the fuel system (if possible) and ignition for that cylinder.
Start PicoScope and the engine.
You may need to adjust the timebase and voltage scales to achieve the best signal display.
Once you have captured your waveform you will be able to see everything that is taking place in every 720° cycle of the engine.
To help you understand what you are seeing, use the rotation markers.
You can adjust these markers to show four partitions, dividing the waveform into 180° sections and revealing the four-stroke cycle.
Now, with every stroke of the engine you can reveal exactly how the cylinder under test is operating: TDC > ex valve opening > exhaust valve closing > inlet valve opening > inlet valve closing > BDC.
Switching the pressure transducer from one cylinder to the next is an easy way to have a direct and valuable comparison.
Remember, it is not any more difficult to attach than a standard compression gauge, but it will give you so much more information.
You can also save the first cylinder as a reference against the remaining cylinders.
Viewing all this lets you make a complete and accurate engine diagnosis.
You can do this before you undertake a time-consuming and expensive engine dismantle.
In addition, should a dismantle be required, it lets the technician identify where a fault is most likely to be found when work begins.
You can find more help and advice by following the ‘more details’ link below.

